


The Case for Raising STRC’s Dividend: 11.5% Is Falling Short
The Case for Raising STRC’s Dividend: 11.5% Is Falling Short Adam Back's BSTR SPAC Merger on Track to Close This Month BitcoinTreasuries.net names Hemi as preferred Onchain Treasury and Finance Partner Presented by Hemi STRC vs SATA: What Bitcoin Income Investors Need to Know. Smarter Web Moves to Launch UK’s First Bitcoin "Preferred" Stock
The Case for Raising STRC’s Dividend: 11.5% Is Falling Short Adam Back's BSTR SPAC Merger on Track to Close This Month BitcoinTreasuries.net names Hemi as preferred Onchain Treasury and Finance Partner Presented by Hemi STRC vs SATA: What Bitcoin Income Investors Need to Know. Smarter Web Moves to Launch UK’s First Bitcoin "Preferred" Stock The Bitcoin Price That Breaks Strategy and STRC
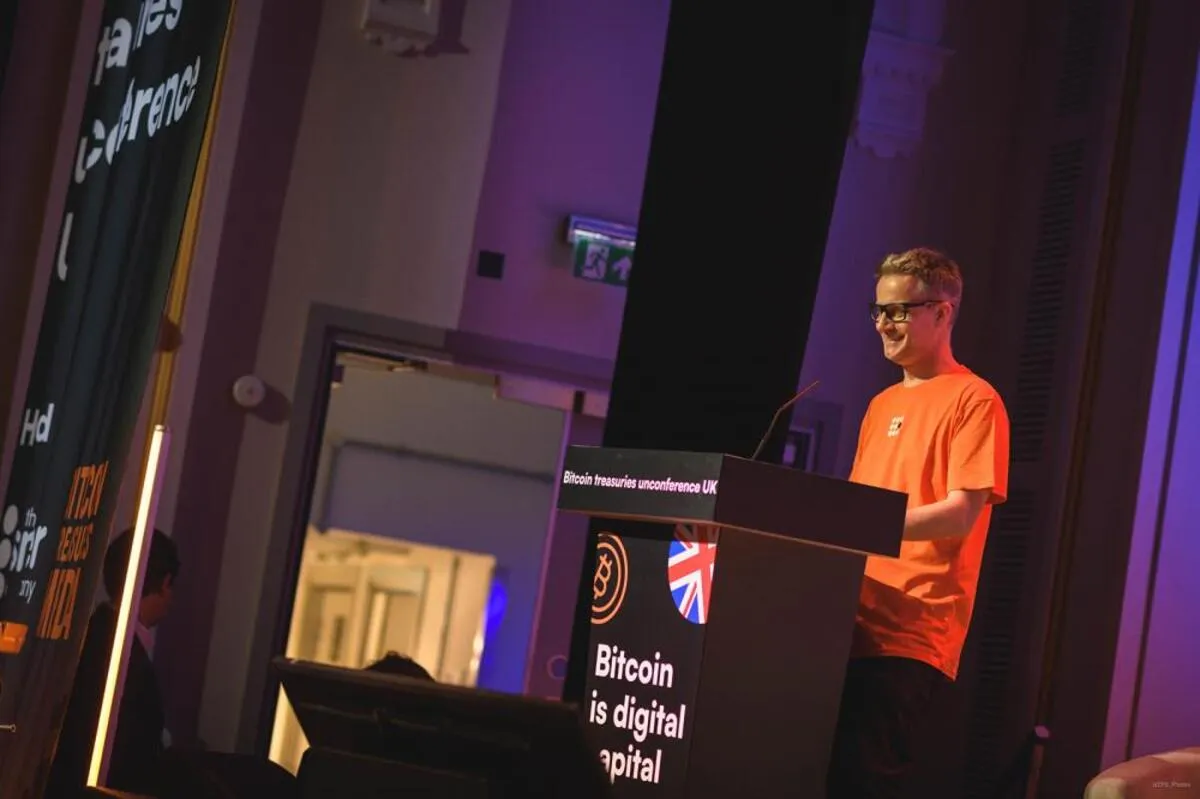
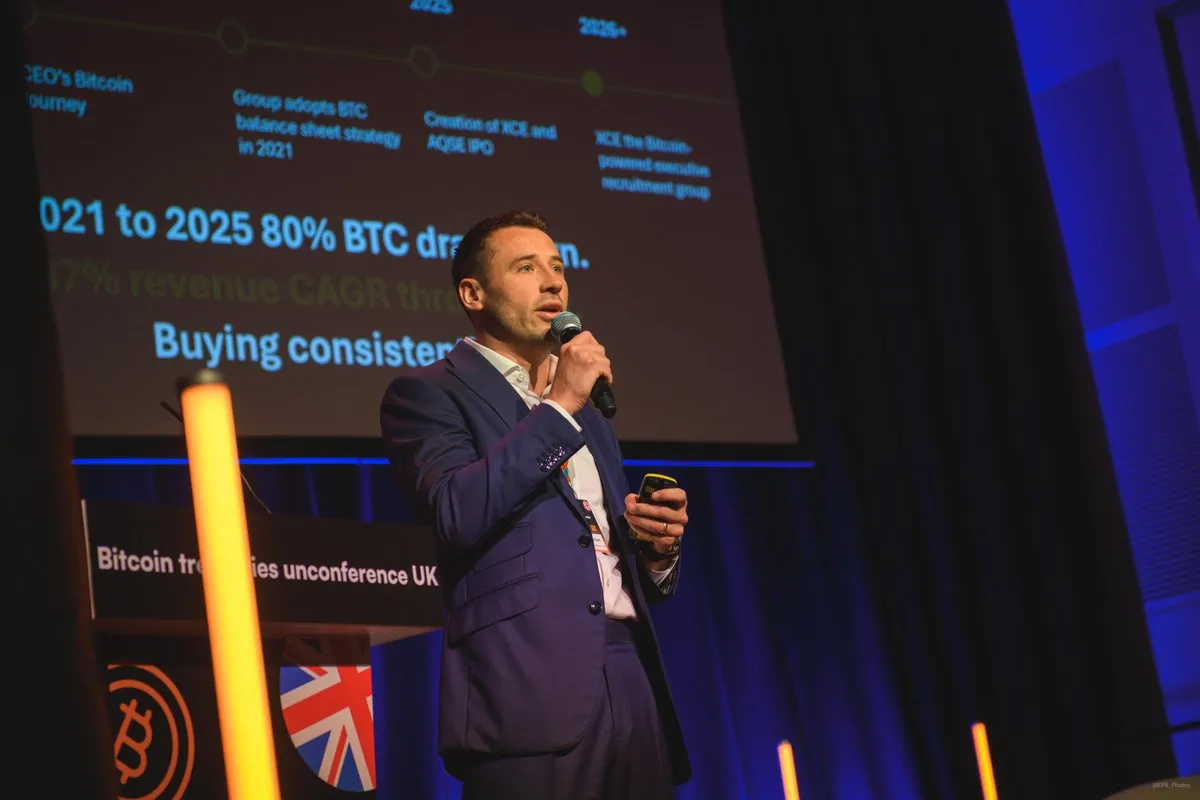
Replay: Bitcoin Treasuries Unconference UK
Watch the Bitcoin Treasuries Unconference UK 2026 replay. Featuring Phong Le (Strategy), Matt Cole (Strive), Kwasi Kwarteng, Alexandre Laizet & Lance Vitanza (TD Cowen) with 25+ speakers.
Government Bitcoin Holdings
Monitor government Bitcoin holdings globally. Track BTC reserves held by countries, states, and government agencies with detailed acquisition data.
BTC Held by Government Entities
649,922
$39.61B
Number of Government Entities
13
BTC Price
$60,944
Asset Dominance
95.8%
BTC 95.8% ETH 3.5% SOL .39% BNB .13% XRP .16%
Governments and Countries Ranked by Bitcoin Holdings
| # | Name | ||||
|---|---|---|---|---|---|
| 1 | 🇺🇸 | ₿ 328,372 | $20,012M | 1.564% | |
| 2 | 🇨🇳 | ₿ 190,000 | $11,579M | 0.905% | |
| 3 | 🇬🇧 | ₿ 61,245 | $3,732M | 0.292% | |
| 4 | 🇺🇦 | ₿ 46,351 | $2,825M | 0.221% | |
| 5 | 🇸🇻 | ₿ 7,674 | $468M | 0.037% | |
| 6 | 🇦🇪 | ₿ 6,420 | $391M | 0.031% | |
| 7 | 🇧🇹 | ₿ 4,973 | $303M | 0.024% | |
| 8 | 🇰🇿 | ₿ 3,544 | $216M | 0.017% | |
| 9 | 🇰🇵 | ₿ 803 | $49M | 0.004% | |
| 10 | 🇻🇪 | ₿ 240 | $15M | 0.001% | |
| 11 | 🇹🇼 | ₿ 210 | $13M | 0.001% | |
| 12 | 🇫🇮 | ₿ 90 | $5M | 0.000% | |
| 13 | 🇺🇸 | ₿ 0 | $0M | 0.000% | |
| 14 | 🇧🇬 | ₿ 0 | $0M | 0.000% | |
| 15 | 🇩🇪 | ₿ 0 | $0M | 0.000% | |
Total: | 649,922 | $39,609M | 3.095% | ||
